The idea in one sentence
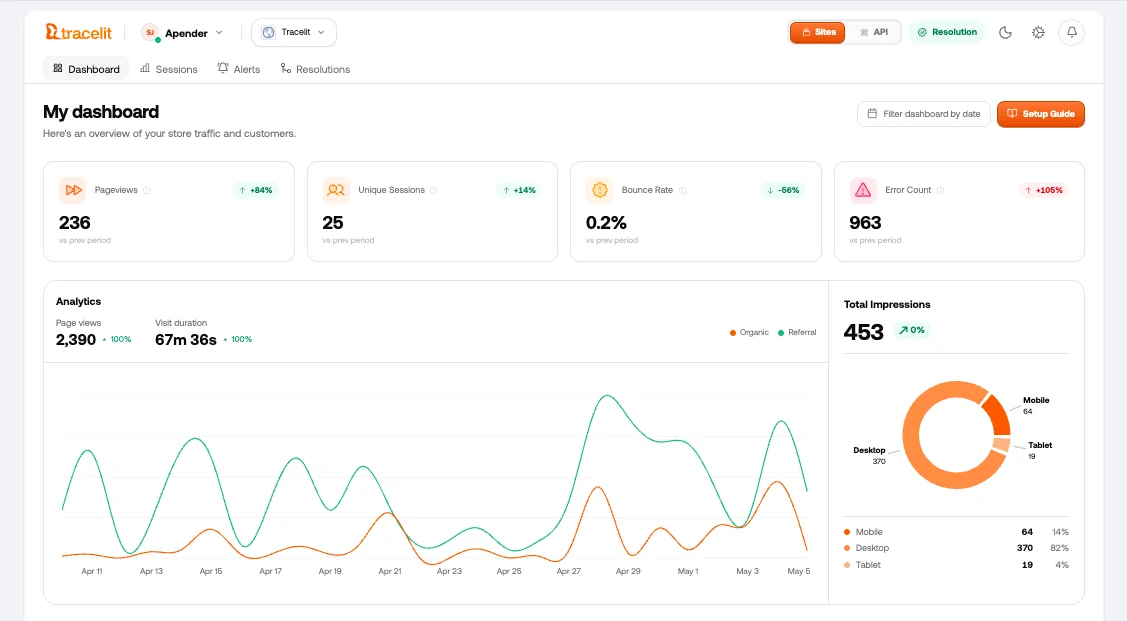
You add one script (or onenpm install) to your site, and Tracelit silently records everything happening — then surfaces what actually matters inside a clean dashboard.
No configuration. No cookies. No PII. Under 20 KB.
What gets captured automatically
The moment you add Tracelit, all of this starts working — zero extra setup:| What | Why it matters |
|---|---|
| Page views | Every visit, including SPA route changes in React, Next.js, Vue, etc. |
| Clicks & rage clicks | Exactly where visitors tap, and where they get frustrated |
| Scroll depth | How far people actually read |
| Session replay | Watch real recordings of visitor sessions |
| Heatmaps | The most-clicked areas of every page |
| JavaScript errors | Alerted the moment something breaks |
| API errors | Failing network requests caught before users complain |
| Performance metrics | TTFB, LCP, FCP, and page load times |
| Form interactions | Where people drop off (no values ever captured) |
| Live visitor count | Who is on your site right now |
| Session summaries | Bounce rate, time on site, scroll depth — automatic |
| User identification | Link sessions to your own user IDs — no PII forced |
Pick your path
5-minute quickstart
Paste one script tag and you’re live. No account config needed beyond your token.
Feature tagging
Mark flows like checkout or onboarding so you can filter and jump to them in replays.
Session replay
Watch exactly what your users saw and did, second by second.
Error tracking
Every JS error, failed API call, and broken resource — linked to the session replay.
Identify users
Connect sessions to real users in your system with one line of code.
Configuration reference
Every init option, replay setting, and privacy control explained.