

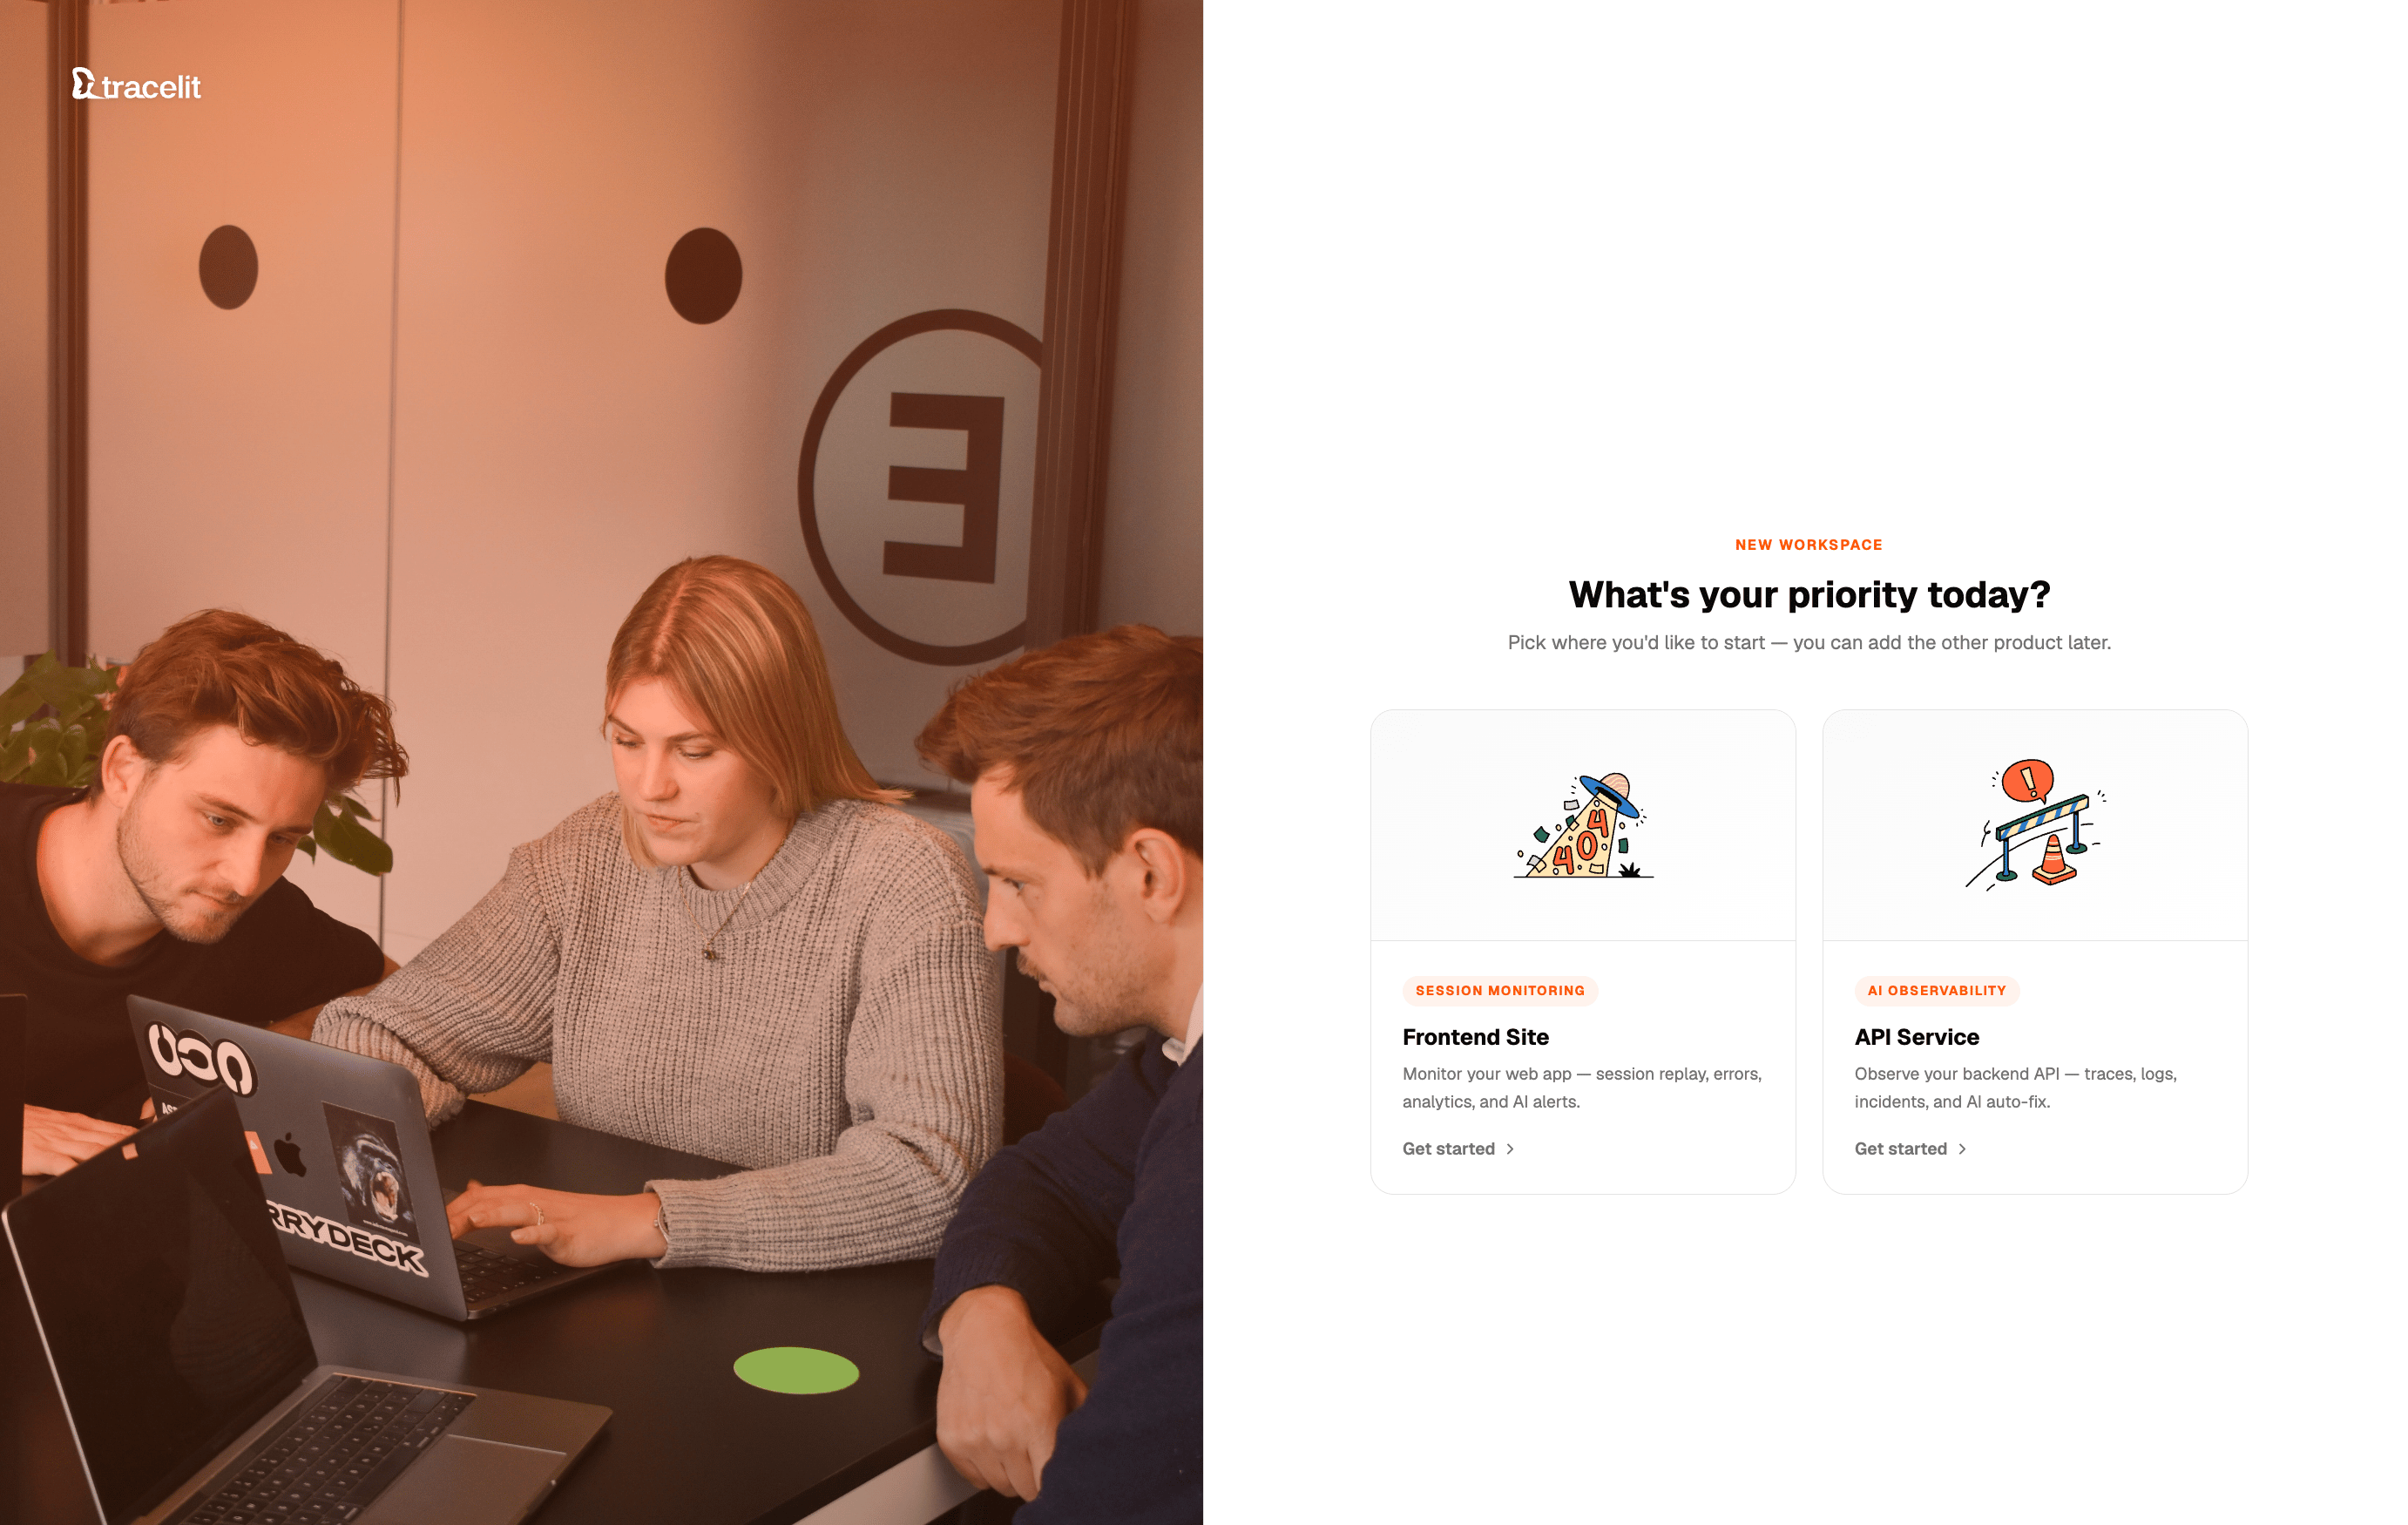
Environment is not optional. Wrong values get dropped or mis-tagged.
Sites default to
| Surface | Field | Allowed values |
|---|---|---|
| Sites (tracker) | environment | development, production |
| Services (OpenTelemetry) | deployment.environment | local, development, production |
development if omitted. Services must set deployment.environment explicitly in the resource attributes.Frontend
Same choice as in the Tracelit app when you add a site: I’m an engineer (paste code) or I’m a vibe coder (paste a prompt into your AI).- I'm an engineer
- I'm a vibe coder

@tracelit/tracker (or the script tag), pass your site token, and always set environment to development or production.npm install @tracelit/tracker
- HTML5
- React
- Next.js App
- Next.js Pages
- Vue
- Svelte
- Angular

<head> — no npm required:<script>
!function(w,d){
var t=w.__tl={
_q:[],
token:'YOUR_SITE_TOKEN',
environment:'production' // or "development"
};
['init','identify','reset','startReplay','stopReplay','optOut','optIn','destroy']
.forEach(function(m){t[m]=function(){t._q.push([m,[].slice.call(arguments)])}});
var s=d.createElement('script');s.async=!0;
s.src='https://cdn.tracelit.app/t.js';d.head.appendChild(s);
}(window,document);
</script>
// src/main.tsx or src/App.tsx
import { init } from '@tracelit/tracker'

init({
  token: 'YOUR_SITE_TOKEN',
  environment: 'production', // or "development"
})
// components/Tracelit.tsx
'use client'
import { useEffect } from 'react'
import { init } from '@tracelit/tracker'

export function Tracelit() {
  useEffect(() => {
    init({
      token: 'YOUR_SITE_TOKEN',
      environment: 'production', // or "development"
    })
  }, [])
  return null
}
<Tracelit /> in app/layout.tsx.Full guide: Next.js App Router// pages/_app.tsx
import { useEffect } from 'react'
import { init } from '@tracelit/tracker'
import type { AppProps } from 'next/app'
export default function App({ Component, pageProps }: AppProps) {
useEffect(() => {
init({
token: 'YOUR_SITE_TOKEN',
environment: 'production', // or "development"
})
}, [])
return <Component {...pageProps} />
}
// src/main.ts
import { createApp } from 'vue'
import { init } from '@tracelit/tracker'
import App from './App.vue'

init({
  token: 'YOUR_SITE_TOKEN',
  environment: 'production', // or "development"
})
createApp(App).mount('#app')
<!-- src/routes/+layout.svelte -->
<script>
  import { onMount } from 'svelte'
  import { init } from '@tracelit/tracker'

  onMount(() =>
    init({
      token: 'YOUR_SITE_TOKEN',
      environment: 'production', // or "development"
    })
  )
</script>

<slot />
// src/app/app.component.ts
import { Component, OnInit } from '@angular/core'
import { init } from '@tracelit/tracker'

@Component({
  selector: 'app-root',
  templateUrl: './app.component.html',
})
export class AppComponent implements OnInit {
  ngOnInit() {
    init({
      token: 'YOUR_SITE_TOKEN',
      environment: 'production', // or "development"
    })
  }
}

Install Tracelit in my project.

Framework: <react | next-app-router | next-pages-router | vue | sveltekit | angular | plain-html>
Site token: YOUR_SITE_TOKEN
Environment: production

Rules:
1) If this is a JS framework, install @tracelit/tracker and call init({ token, environment }) in the app root/entry (or Client Component for Next App Router).
2) environment must be exactly "production" or "development".
3) If plain HTML / HTML5, add the Tracelit script in <head> with token and environment on __tl (cdn.tracelit.app/t.js).
4) Keep changes minimal. Show changed files and a 30-second verify checklist.
Verify (frontend)
Open the site, click around, then check the Tracelit app:- Live visitor under the site
- A new session in Sessions
- Page views / clicks appearing
Backend
Same choice when you add a service in the app: I’m an engineer (recipe in code) or I’m a vibe coder (AI prompt).Protocol must be
http/protobuf. gRPC exporters will fail silently against Tracelit ingest.Set deployment.environment to exactly one of: local, development, production.| Setting | Value |
|---|---|
| Endpoint | https://ingest.tracelit.app |
| Protocol | http/protobuf |
| Auth header | Authorization=Bearer <INGEST_KEY> |
| Service name | your service name (e.g. payments-api) |
| Environment | local | development | production |
- I'm an engineer
- I'm a vibe coder
OTEL_* vars required for a quickstart.- Node.js
- Go
- Python
- Java
- .NET
- Ruby
- Rust
npm install @opentelemetry/sdk-node @opentelemetry/api \
  @opentelemetry/auto-instrumentations-node \
  @opentelemetry/exporter-trace-otlp-proto \
  @opentelemetry/exporter-logs-otlp-proto \
  @opentelemetry/sdk-logs @opentelemetry/resources
// tracelit-otel.cjs — load before your app
const { NodeSDK } = require('@opentelemetry/sdk-node')
const { resourceFromAttributes } = require('@opentelemetry/resources')
const { OTLPTraceExporter } = require('@opentelemetry/exporter-trace-otlp-proto')
const { OTLPLogExporter } = require('@opentelemetry/exporter-logs-otlp-proto')
const { BatchLogRecordProcessor } = require('@opentelemetry/sdk-logs')
const { getNodeAutoInstrumentations } = require('@opentelemetry/auto-instrumentations-node')

const endpoint = 'https://ingest.tracelit.app'
const headers = { Authorization: 'Bearer <INGEST_KEY>' }

const sdk = new NodeSDK({
  resource: resourceFromAttributes({
    'service.name': 'payments-api',
    'deployment.environment': 'production', // local | development | production
  }),
  traceExporter: new OTLPTraceExporter({ url: `${endpoint}/v1/traces`, headers }),
  logRecordProcessor: new BatchLogRecordProcessor(
    new OTLPLogExporter({ url: `${endpoint}/v1/logs`, headers })
  ),
  instrumentations: [getNodeAutoInstrumentations()],
})

sdk.start()
NODE_OPTIONS="--require ./tracelit-otel.cjs" node server.jsFull guide: Node.js OpenTelemetrygo get go.opentelemetry.io/otel@latest
go get go.opentelemetry.io/otel/sdk@latest
go get go.opentelemetry.io/otel/exporters/otlp/otlptrace/otlptracehttp@latest
go get go.opentelemetry.io/otel/exporters/otlp/otlplog/otlploghttp@latest
go get go.opentelemetry.io/otel/sdk/log@latest
go get go.opentelemetry.io/otel/sdk/resource@latest
main, build resource + OTLP HTTP exporters in code:res, _ := resource.Merge(
resource.Default(),
resource.NewWithAttributes(
semconv.SchemaURL,
semconv.ServiceName("payments-api"),
semconv.DeploymentEnvironmentName("production"), // local | development | production
),
)
traceExp, _ := otlptracehttp.New(ctx,
otlptracehttp.WithEndpoint("ingest.tracelit.app"),
otlptracehttp.WithURLPath("/v1/traces"),
otlptracehttp.WithHeaders(map[string]string{
"Authorization": "Bearer <INGEST_KEY>",
}),
)
logExp, _ := otlploghttp.New(ctx,
otlploghttp.WithEndpoint("ingest.tracelit.app"),
otlploghttp.WithURLPath("/v1/logs"),
otlploghttp.WithHeaders(map[string]string{
"Authorization": "Bearer <INGEST_KEY>",
}),
)
// Wire TracerProvider + LoggerProvider with res, then bridge slog/zap/logrus
python -m pip install opentelemetry-sdk opentelemetry-exporter-otlp-proto-http \
  opentelemetry-instrumentation
from opentelemetry import trace
from opentelemetry.sdk.resources import Resource
from opentelemetry.sdk.trace import TracerProvider
from opentelemetry.sdk.trace.export import BatchSpanProcessor
from opentelemetry.exporter.otlp.proto.http.trace_exporter import OTLPSpanExporter
from opentelemetry.sdk._logs import LoggerProvider, LoggingHandler
from opentelemetry.sdk._logs.export import BatchLogRecordProcessor
from opentelemetry.exporter.otlp.proto.http._log_exporter import OTLPLogExporter
from opentelemetry._logs import set_logger_provider
import logging

resource = Resource.create({
    "service.name": "payments-api",
    "deployment.environment": "production",  # local | development | production
})
headers = {"Authorization": "Bearer <INGEST_KEY>"}
endpoint = "https://ingest.tracelit.app"

tp = TracerProvider(resource=resource)
tp.add_span_processor(BatchSpanProcessor(OTLPSpanExporter(
    endpoint=f"{endpoint}/v1/traces", headers=headers
)))
trace.set_tracer_provider(tp)

lp = LoggerProvider(resource=resource)
lp.add_log_record_processor(BatchLogRecordProcessor(OTLPLogExporter(
    endpoint=f"{endpoint}/v1/logs", headers=headers
)))
set_logger_provider(lp)
logging.getLogger().addHandler(LoggingHandler(logger_provider=lp))
curl -sSL -o opentelemetry-javaagent.jar \
  https://github.com/open-telemetry/opentelemetry-java-instrumentation/releases/latest/download/opentelemetry-javaagent.jar

java \
  -javaagent:./opentelemetry-javaagent.jar \
  -Dotel.service.name=payments-api \
  -Dotel.resource.attributes=deployment.environment=production \
  -Dotel.exporter.otlp.endpoint=https://ingest.tracelit.app \
  -Dotel.exporter.otlp.protocol=http/protobuf \
  -Dotel.exporter.otlp.headers=Authorization=Bearer\ <INGEST_KEY> \
  -jar your-app.jar
dotnet add package OpenTelemetry.Extensions.Hosting
dotnet add package OpenTelemetry.Exporter.OpenTelemetryProtocol
dotnet add package OpenTelemetry.Instrumentation.AspNetCore
dotnet add package OpenTelemetry.Instrumentation.Http
builder.Services.AddOpenTelemetry()
    .ConfigureResource(r => r
        .AddService("payments-api")
        .AddAttributes(new Dictionary<string, object>
        {
            ["deployment.environment"] = "production" // local | development | production
        }))
    .WithTracing(t => t
        .AddAspNetCoreInstrumentation()
        .AddHttpClientInstrumentation()
        .AddOtlpExporter(o =>
        {
            o.Endpoint = new Uri("https://ingest.tracelit.app/v1/traces");
            o.Protocol = OtlpExportProtocol.HttpProtobuf;
            o.Headers = "Authorization=Bearer <INGEST_KEY>";
        }))
    .WithLogging(l => l.AddOtlpExporter(o =>
    {
        o.Endpoint = new Uri("https://ingest.tracelit.app/v1/logs");
        o.Protocol = OtlpExportProtocol.HttpProtobuf;
        o.Headers = "Authorization=Bearer <INGEST_KEY>";
    }));
bundle add opentelemetry-sdk opentelemetry-exporter-otlp opentelemetry-instrumentation-all
OpenTelemetry::SDK.configure do |c|
  c.service_name = "payments-api"
  c.resource = OpenTelemetry::SDK::Resources::Resource.create(
    "deployment.environment" => "production" # local | development | production
  )
  c.add_span_processor(
    OpenTelemetry::SDK::Trace::Export::BatchSpanProcessor.new(
      OpenTelemetry::Exporter::OTLP::Exporter.new(
        endpoint: "https://ingest.tracelit.app/v1/traces",
        headers: { "Authorization" => "Bearer <INGEST_KEY>" }
      )
    )
  )
  c.use_all
end
Configure the OTLP HTTP exporter with:
- endpoint
https://ingest.tracelit.app - protocol
http/protobuf - header
Authorization: Bearer <INGEST_KEY> - resource attrs
service.name+deployment.environment(local|development|production)
Point OpenTelemetry at Tracelit for my backend service.

Language: <node | go | python | java | dotnet | ruby | rust>
Ingest key: <INGEST_KEY>
Service name: payments-api
Environment: production

Rules:
1) Use OTLP HTTP (http/protobuf) to https://ingest.tracelit.app — not gRPC.
2) Set Authorization: Bearer <INGEST_KEY> on exporters.
3) Set deployment.environment to exactly one of: local, development, production.
4) Export both traces AND logs (LoggerProvider / log bridge required).
5) Prefer in-code config over shell OTEL_* env vars.
6) Keep changes minimal. Show files changed and how to emit one INFO + one ERROR to verify.
Verify (backend)
Emit one INFO log and one ERROR log, then use Check connection in onboarding (or open Logs on the service). Continue only when both appear.What’s next?
| Topic | Guide |
|---|---|
| Frontend install deep-dives | Platform → Frontend |
| OpenTelemetry language recipes | Platform → Backend |
| Identify users | Identify users |
| Incidents → AI PR | Incidents |
| Tracker config reference | Configuration |