> ## Documentation Index
> Fetch the complete documentation index at: https://docs.tracelit.io/llms.txt
> Use this file to discover all available pages before exploring further.
# Structured logs
> Forward logs from your existing logger to Tracelit. Every log record is automatically correlated to its trace via trace_id and span_id — no changes to your logging code.
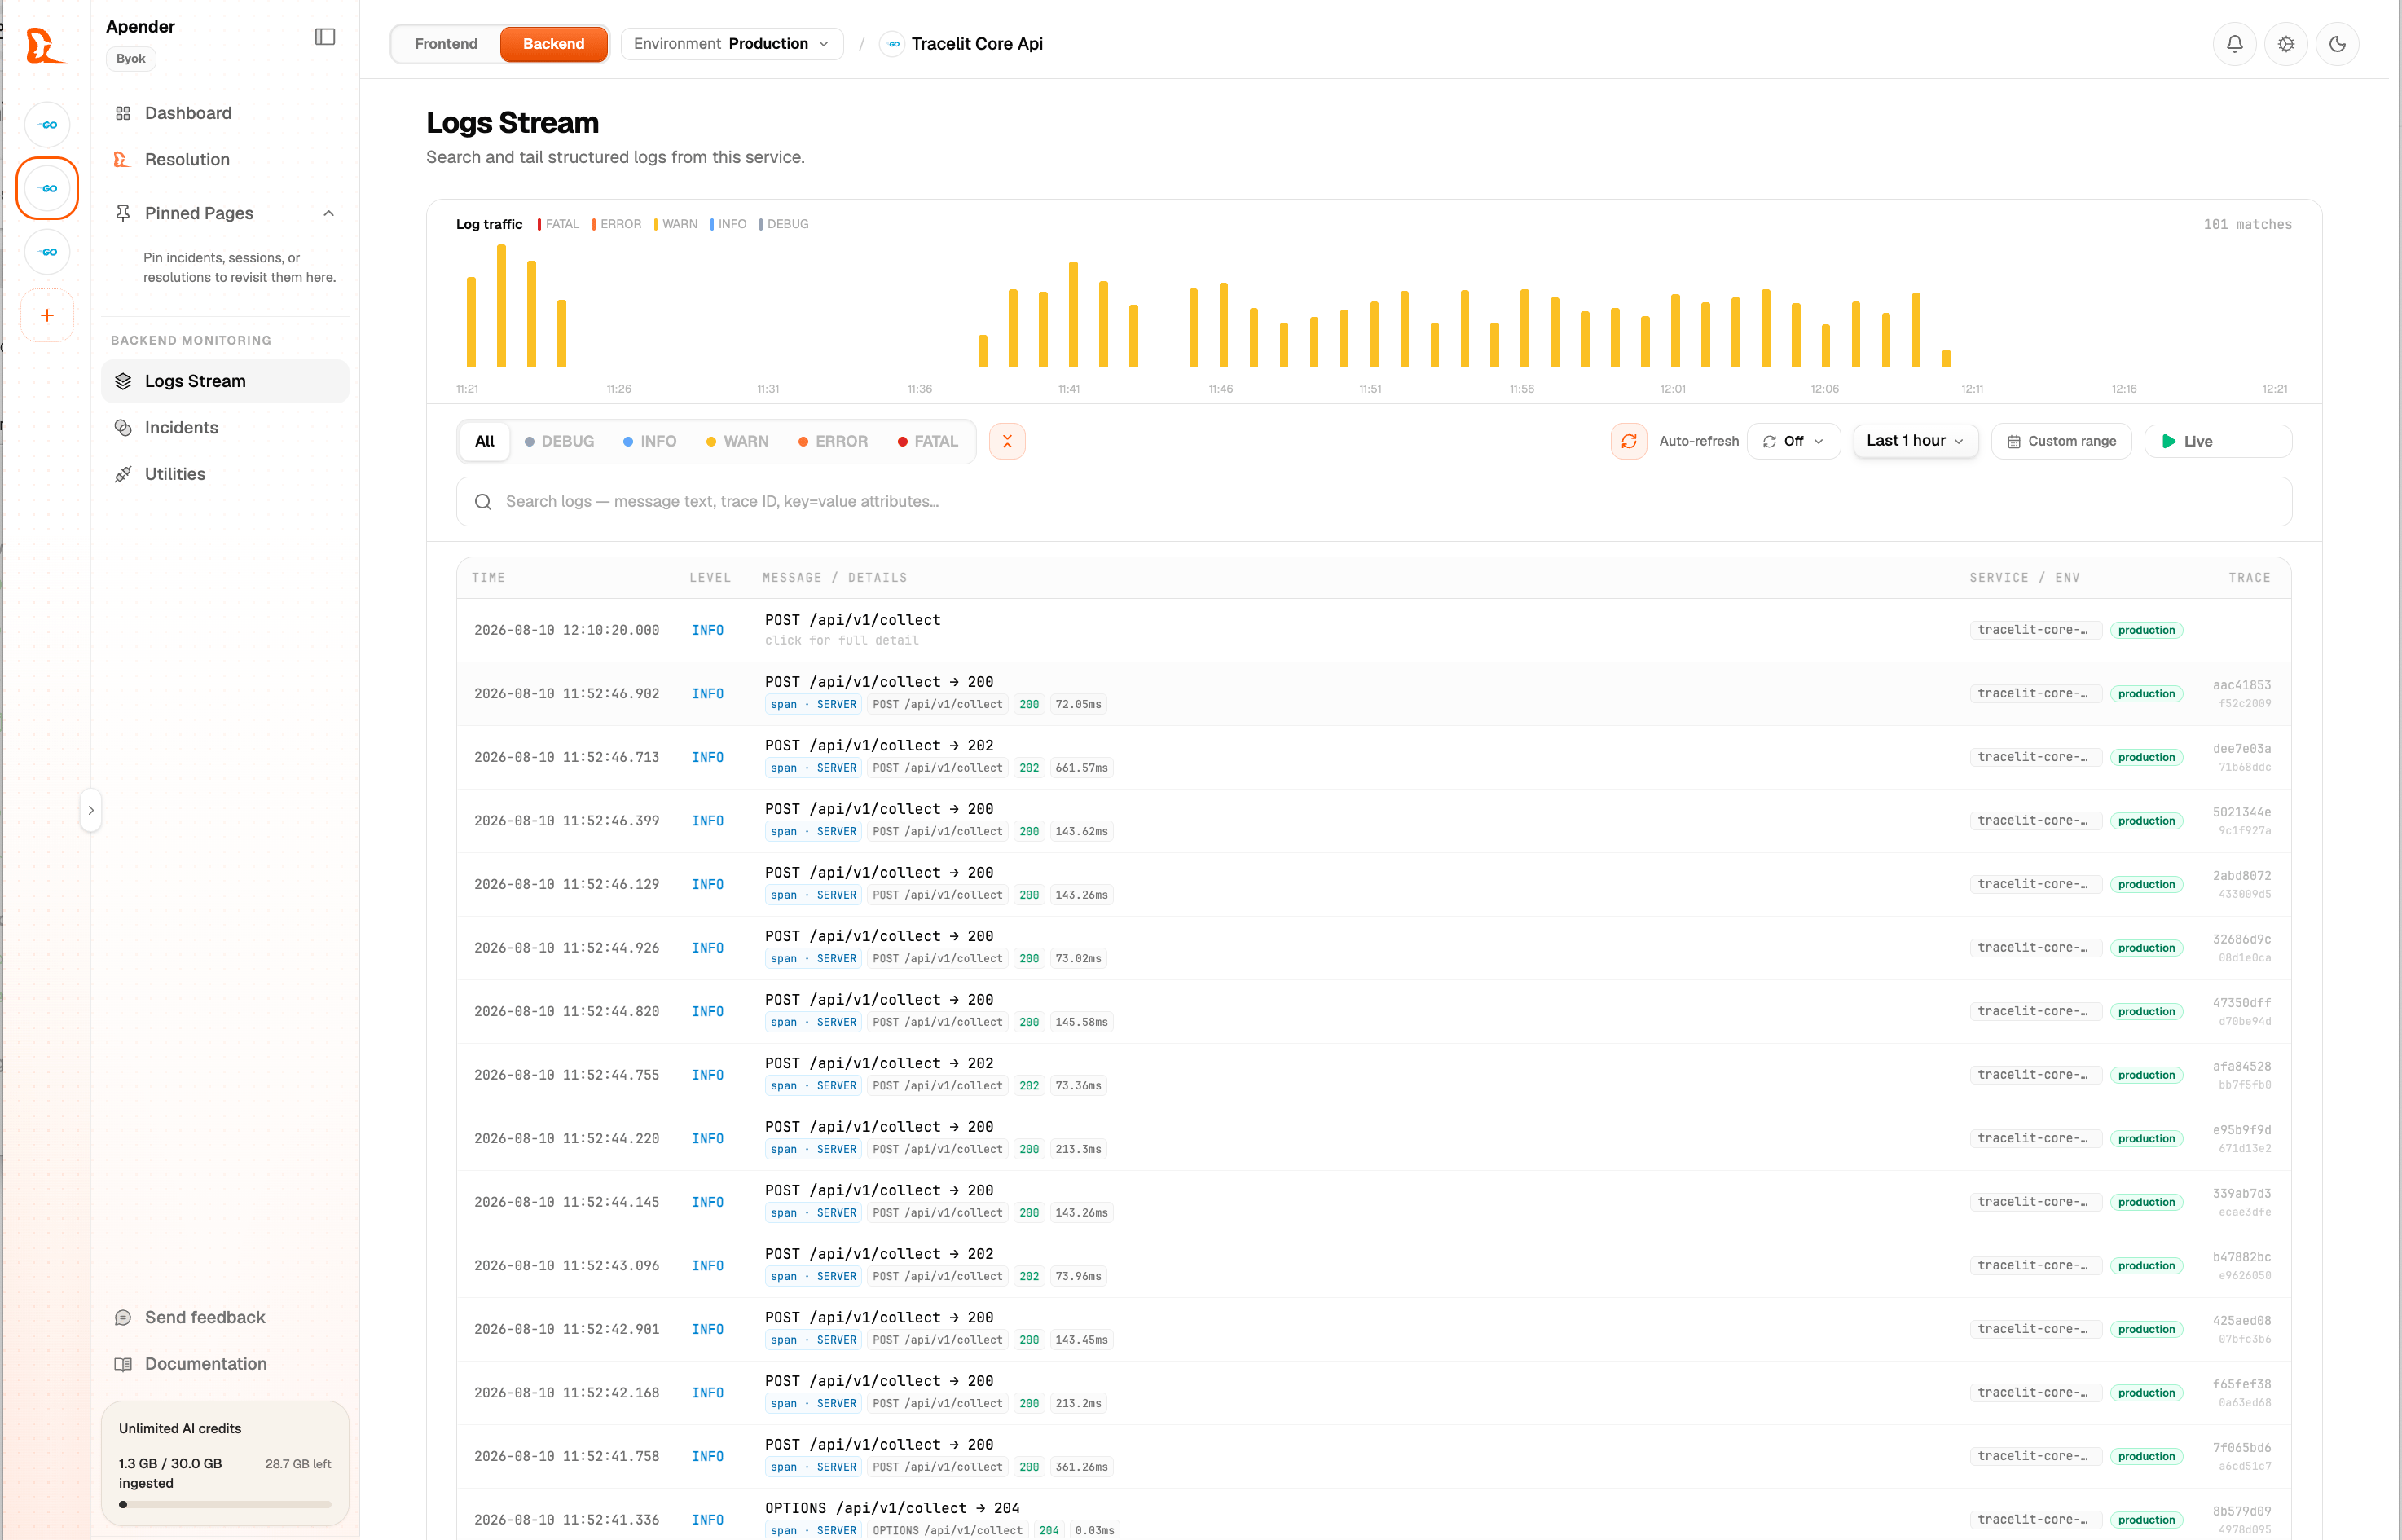
Tracelit bridges your existing logger to the OpenTelemetry log pipeline. Your current log setup keeps working exactly as before — Tracelit just adds a second destination and automatically injects `trace_id` and `span_id` from the active span context.
Don't want to instrument in-process? You can still ship logs via OpenTelemetry bridges documented under [Telemetry](/otel/overview), or use log drains where supported. Structured logs in Tracelit expect OTLP (or a drain) with a bridged logger.
 ***
## How log-trace correlation works
When a log is emitted inside an active span, the SDK reads the trace and span IDs from the current context and attaches them to the log record before export. In the Tracelit dashboard, every log entry links directly to its parent trace — no manual field mapping needed.
***
## Per-SDK setup
### Console bridge (automatic)
No setup required. Once `Tracelit.start()` is called, all `console.*` calls are forwarded automatically.
| Method | Severity |
| ------------------------------- | -------- |
| `console.debug` / `console.log` | DEBUG |
| `console.info` | INFO |
| `console.warn` | WARN |
| `console.error` | ERROR |
Original console output is preserved — nothing changes for your existing log pipeline.
### Winston
```typescript theme={null}
import winston from "winston";
import { WinstonTransport } from "@tracelit/sdk";
import { logs } from "@opentelemetry/api-logs";
const logger = winston.createLogger({
transports: [
new winston.transports.Console(),
new WinstonTransport(logs.getLoggerProvider()),
],
});
logger.info("Order created", { orderId: "ord_123" });
```
### Pino
```typescript theme={null}
import pino from "pino";
import { createPinoDestination } from "@tracelit/sdk";
import { logs } from "@opentelemetry/api-logs";
const logger = pino(
pino.multistream([
{ stream: process.stdout },
{ stream: createPinoDestination(logs.getLoggerProvider()) },
])
);
logger.info({ orderId: "ord_123" }, "Order created");
```
All Go bridges attach `trace_id` and `span_id` automatically when a `context.Context` carrying a span is passed.
### slog (standard library)
```go theme={null}
import (
"log/slog"
"github.com/tracelit-ai/tracelit-go/bridge"
)
slog.SetDefault(slog.New(bridge.NewSlogHandler()))
// Pass ctx to correlate logs with the active span
slog.InfoContext(ctx, "order created", "order_id", order.ID)
```
### zap
```go theme={null}
import (
"github.com/tracelit-ai/tracelit-go/bridge"
"go.uber.org/zap"
"go.uber.org/zap/zapcore"
)
stdoutLogger, _ := zap.NewProduction()
logger := zap.New(zapcore.NewTee(
stdoutLogger.Core(),
bridge.NewZapCore("payments-api"),
), zap.AddCaller())
logger.Info("order created", zap.String("order_id", order.ID))
```
### logrus
```go theme={null}
import (
"github.com/sirupsen/logrus"
"github.com/tracelit-ai/tracelit-go/bridge"
)
logrus.AddHook(bridge.NewLogrusHook())
logrus.WithContext(ctx).WithField("order_id", order.ID).Info("order created")
```
### zerolog
```go theme={null}
import (
"github.com/rs/zerolog/log"
"github.com/tracelit-ai/tracelit-go/bridge"
)
log.Logger = zerolog.New(bridge.NewZerologWriter(os.Stderr)).
With().Timestamp().Logger()
log.Ctx(ctx).Info().Str("order_id", order.ID).Msg("order created")
```
When Rails is present, `Tracelit.start!` registers a broadcast target on `Rails.logger`. Every log is forwarded to Tracelit with trace correlation automatically injected.
```ruby theme={null}
# No changes needed — this already works after SDK setup
Rails.logger.info("Order #{order.id} created", { amount: order.total })
# ↑ Tracelit adds trace_id + span_id automatically
```
Original logger output is preserved. The broadcast target runs alongside your existing log destinations.
When `AddTracelit()` is registered, all `ILogger` output is forwarded to Tracelit via OTLP. No changes to your existing logger code or DI setup.
```csharp theme={null}
public class OrdersService
{
private readonly ILogger _logger;
public OrdersService(ILogger logger)
{
_logger = logger;
}
public async Task CreateAsync(CreateOrderRequest req)
{
// trace_id + span_id from the current Activity are injected automatically
_logger.LogInformation("Processing order for {Channel}", req.Channel);
var order = await _repository.InsertAsync(req);
_logger.LogInformation("Order {OrderId} created", order.Id);
return order;
}
}
```
***
## Querying logs in Tracelit
Logs are available in the **Logs** tab of your service. You can:
* Filter by severity, service, environment, and time range
* Full-text search across log bodies and structured fields
* Click any log entry to jump directly to its linked trace
* Tail logs in real time during deploys or incidents
***
## Learn more
| Topic | Description | Guide |
| -------------------------------------------------- | ------------------------------------------------------------------------ | ------------------------------------- |
| **Distributed tracing** | Every log is linked to a trace. See how traces are captured. | [Read](/features/distributed-tracing) |
| **Incidents** | Tracelit clusters logs and surfaces patterns as incidents automatically. | [Read](/features/incidents) |
***
## How log-trace correlation works
When a log is emitted inside an active span, the SDK reads the trace and span IDs from the current context and attaches them to the log record before export. In the Tracelit dashboard, every log entry links directly to its parent trace — no manual field mapping needed.
***
## Per-SDK setup
### Console bridge (automatic)
No setup required. Once `Tracelit.start()` is called, all `console.*` calls are forwarded automatically.
| Method | Severity |
| ------------------------------- | -------- |
| `console.debug` / `console.log` | DEBUG |
| `console.info` | INFO |
| `console.warn` | WARN |
| `console.error` | ERROR |
Original console output is preserved — nothing changes for your existing log pipeline.
### Winston
```typescript theme={null}
import winston from "winston";
import { WinstonTransport } from "@tracelit/sdk";
import { logs } from "@opentelemetry/api-logs";
const logger = winston.createLogger({
transports: [
new winston.transports.Console(),
new WinstonTransport(logs.getLoggerProvider()),
],
});
logger.info("Order created", { orderId: "ord_123" });
```
### Pino
```typescript theme={null}
import pino from "pino";
import { createPinoDestination } from "@tracelit/sdk";
import { logs } from "@opentelemetry/api-logs";
const logger = pino(
pino.multistream([
{ stream: process.stdout },
{ stream: createPinoDestination(logs.getLoggerProvider()) },
])
);
logger.info({ orderId: "ord_123" }, "Order created");
```
All Go bridges attach `trace_id` and `span_id` automatically when a `context.Context` carrying a span is passed.
### slog (standard library)
```go theme={null}
import (
"log/slog"
"github.com/tracelit-ai/tracelit-go/bridge"
)
slog.SetDefault(slog.New(bridge.NewSlogHandler()))
// Pass ctx to correlate logs with the active span
slog.InfoContext(ctx, "order created", "order_id", order.ID)
```
### zap
```go theme={null}
import (
"github.com/tracelit-ai/tracelit-go/bridge"
"go.uber.org/zap"
"go.uber.org/zap/zapcore"
)
stdoutLogger, _ := zap.NewProduction()
logger := zap.New(zapcore.NewTee(
stdoutLogger.Core(),
bridge.NewZapCore("payments-api"),
), zap.AddCaller())
logger.Info("order created", zap.String("order_id", order.ID))
```
### logrus
```go theme={null}
import (
"github.com/sirupsen/logrus"
"github.com/tracelit-ai/tracelit-go/bridge"
)
logrus.AddHook(bridge.NewLogrusHook())
logrus.WithContext(ctx).WithField("order_id", order.ID).Info("order created")
```
### zerolog
```go theme={null}
import (
"github.com/rs/zerolog/log"
"github.com/tracelit-ai/tracelit-go/bridge"
)
log.Logger = zerolog.New(bridge.NewZerologWriter(os.Stderr)).
With().Timestamp().Logger()
log.Ctx(ctx).Info().Str("order_id", order.ID).Msg("order created")
```
When Rails is present, `Tracelit.start!` registers a broadcast target on `Rails.logger`. Every log is forwarded to Tracelit with trace correlation automatically injected.
```ruby theme={null}
# No changes needed — this already works after SDK setup
Rails.logger.info("Order #{order.id} created", { amount: order.total })
# ↑ Tracelit adds trace_id + span_id automatically
```
Original logger output is preserved. The broadcast target runs alongside your existing log destinations.
When `AddTracelit()` is registered, all `ILogger` output is forwarded to Tracelit via OTLP. No changes to your existing logger code or DI setup.
```csharp theme={null}
public class OrdersService
{
private readonly ILogger _logger;
public OrdersService(ILogger logger)
{
_logger = logger;
}
public async Task CreateAsync(CreateOrderRequest req)
{
// trace_id + span_id from the current Activity are injected automatically
_logger.LogInformation("Processing order for {Channel}", req.Channel);
var order = await _repository.InsertAsync(req);
_logger.LogInformation("Order {OrderId} created", order.Id);
return order;
}
}
```
***
## Querying logs in Tracelit
Logs are available in the **Logs** tab of your service. You can:
* Filter by severity, service, environment, and time range
* Full-text search across log bodies and structured fields
* Click any log entry to jump directly to its linked trace
* Tail logs in real time during deploys or incidents
***
## Learn more
| Topic | Description | Guide |
| -------------------------------------------------- | ------------------------------------------------------------------------ | ------------------------------------- |
| **Distributed tracing** | Every log is linked to a trace. See how traces are captured. | [Read](/features/distributed-tracing) |
| **Incidents** | Tracelit clusters logs and surfaces patterns as incidents automatically. | [Read](/features/incidents) |