> ## Documentation Index
> Fetch the complete documentation index at: https://docs.tracelit.io/llms.txt
> Use this file to discover all available pages before exploring further.
# Error tracking
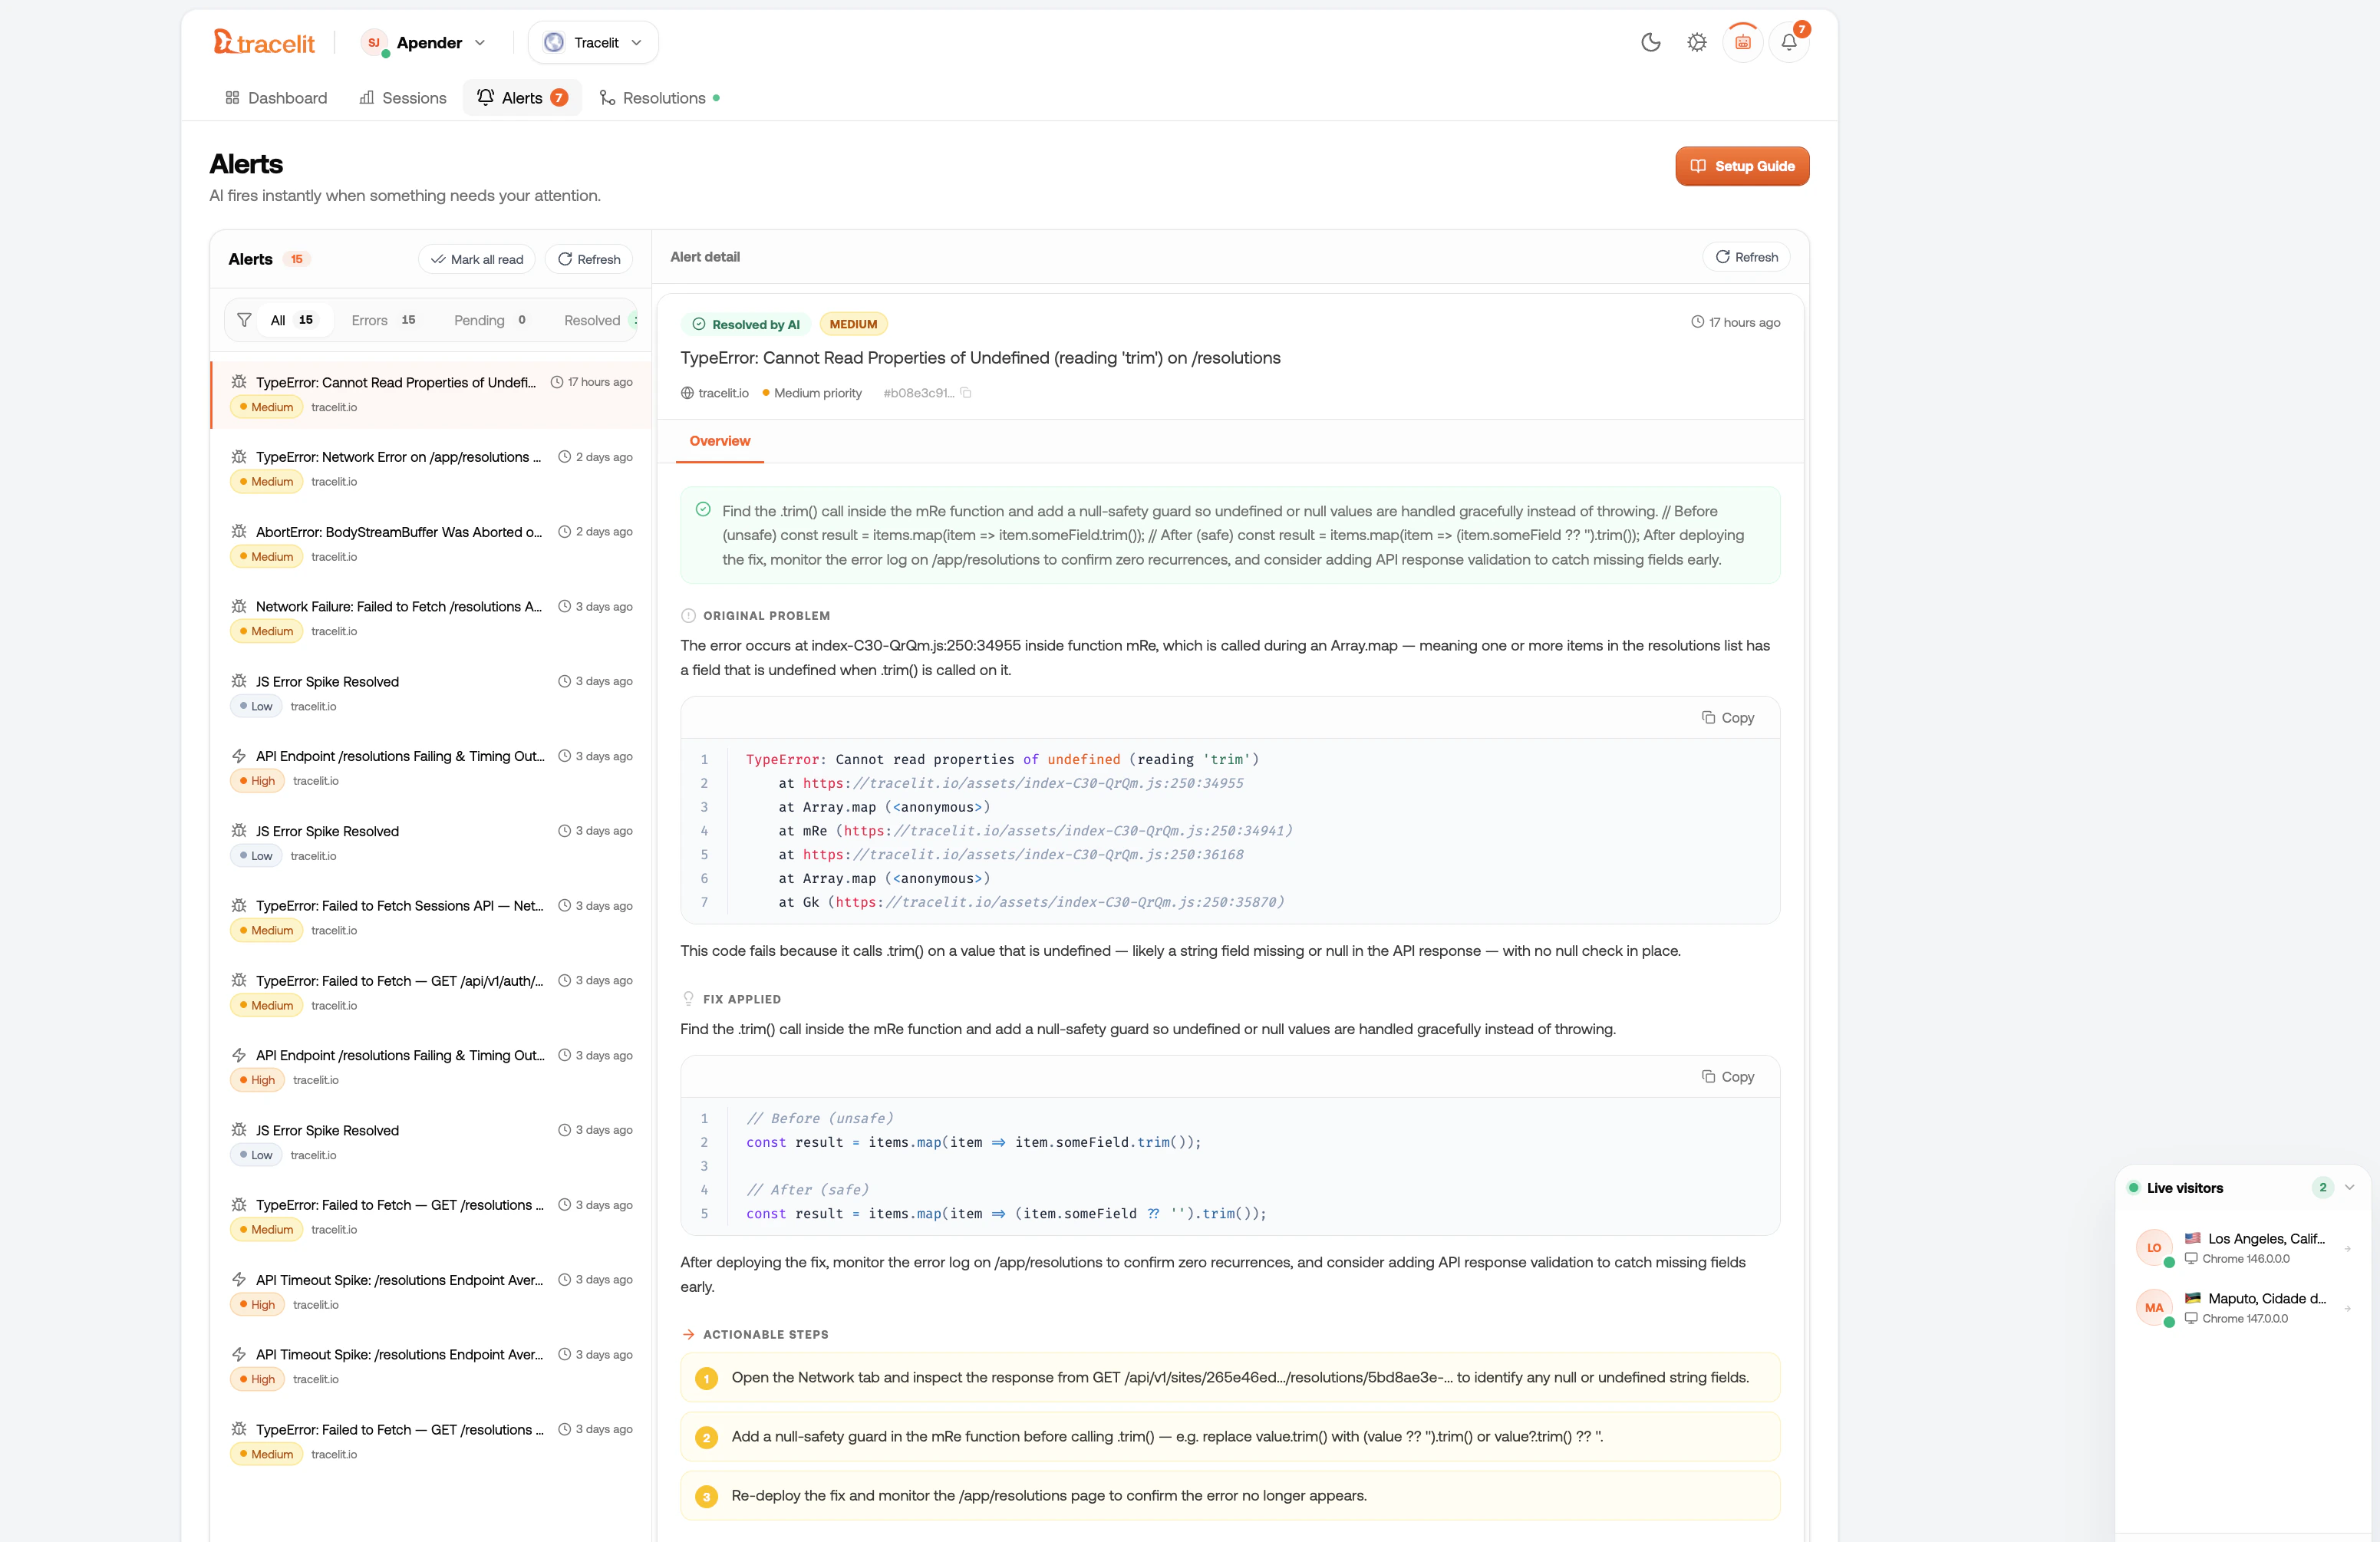
> Automatically capture JavaScript errors, unhandled promise rejections, failed API calls, broken resources, and slow network requests — each linked to its session replay.
Tracelit catches errors automatically the moment you install the tracker. No configuration needed. Every error appears in your dashboard with the full context: what happened, when, which user, and a one-click link to the session replay at the exact moment the error occurred.
 ***
## What Tracelit catches
| Error type | Example |
| ----------------- | ------------------------------------------------------------ |
| `runtime` | Uncaught `TypeError`, `ReferenceError`, any thrown exception |
| `promise` | Unhandled `Promise.reject()` |
| `api` | Fetch or XHR returning 4xx / 5xx |
| `api_slow` | Any request taking longer than 3 seconds |
| `api_network` | Fetch / XHR that fails to connect entirely |
| `graphql` | GraphQL 200 response with an `errors` array in the body |
| `console_error` | Anything logged with `console.error()` (opt-in) |
| `resource` | Broken images, missing fonts, failed script loads |
| `network_offline` | Browser goes offline mid-session |
| `websocket` | WebSocket connection failures or abnormal closure |
| `long_task` | Main thread blocked 150ms+ (with source attribution) |
| `memory` | Device heap approaching limit (Chrome only) |
***
## Capture `console.error` (opt-in)
By default, `console.error` calls are not sent to Tracelit. Enable it with one option:
```ts theme={null}
import { init } from '@tracelit/tracker'
init({
token: 'YOUR_TOKEN_HERE',
environment: 'production',
monitorConsole: true // capture console.error and console.warn
})
```
Only enable this if you're intentional about what gets logged with `console.error`. Avoid logging sensitive data — treat it as if it's always visible.
***
## View errors in the dashboard
From the **Errors** tab in your dashboard you can:
* See error frequency over time (how often, how many users affected)
* Filter by error type, page, or user
* Click any error to see the full stack trace
* Click **Watch session** to open the replay and jump to the exact moment the error fired
***
## Debug mode
During development, turn on `debug: true` to see every captured event — including errors — logged to the browser console:
```ts theme={null}
import { init } from '@tracelit/tracker'
init({
token: 'YOUR_TOKEN_HERE',
environment: 'production',
debug: true // remove before going to production
})
```
***
## No extra setup needed
Every error type in the table above is captured automatically. Tracelit monkey-patches `fetch`, `XMLHttpRequest`, `history.pushState`, `WebSocket`, and `console.error` (if enabled) to intercept failures at the source.
When you call `destroy()`, all patches are cleanly removed and the originals are restored.
***
## Use this AI prompt
```text theme={null}
Set up Tracelit error tracking in my project and make it production-safe.
Requirements:
1) Initialize Tracelit with my token: YOUR_TOKEN_HERE.
2) Enable monitorConsole only if needed and explain the tradeoff.
3) Make sure runtime errors, API errors, and unhandled promises are captured.
4) Add safe guidance so sensitive data is never logged to console.error.
5) Keep edits minimal.
6) Show changed files and explain how to test with one forced JS error and one failed API request.
```
***
## What Tracelit catches
| Error type | Example |
| ----------------- | ------------------------------------------------------------ |
| `runtime` | Uncaught `TypeError`, `ReferenceError`, any thrown exception |
| `promise` | Unhandled `Promise.reject()` |
| `api` | Fetch or XHR returning 4xx / 5xx |
| `api_slow` | Any request taking longer than 3 seconds |
| `api_network` | Fetch / XHR that fails to connect entirely |
| `graphql` | GraphQL 200 response with an `errors` array in the body |
| `console_error` | Anything logged with `console.error()` (opt-in) |
| `resource` | Broken images, missing fonts, failed script loads |
| `network_offline` | Browser goes offline mid-session |
| `websocket` | WebSocket connection failures or abnormal closure |
| `long_task` | Main thread blocked 150ms+ (with source attribution) |
| `memory` | Device heap approaching limit (Chrome only) |
***
## Capture `console.error` (opt-in)
By default, `console.error` calls are not sent to Tracelit. Enable it with one option:
```ts theme={null}
import { init } from '@tracelit/tracker'
init({
token: 'YOUR_TOKEN_HERE',
environment: 'production',
monitorConsole: true // capture console.error and console.warn
})
```
Only enable this if you're intentional about what gets logged with `console.error`. Avoid logging sensitive data — treat it as if it's always visible.
***
## View errors in the dashboard
From the **Errors** tab in your dashboard you can:
* See error frequency over time (how often, how many users affected)
* Filter by error type, page, or user
* Click any error to see the full stack trace
* Click **Watch session** to open the replay and jump to the exact moment the error fired
***
## Debug mode
During development, turn on `debug: true` to see every captured event — including errors — logged to the browser console:
```ts theme={null}
import { init } from '@tracelit/tracker'
init({
token: 'YOUR_TOKEN_HERE',
environment: 'production',
debug: true // remove before going to production
})
```
***
## No extra setup needed
Every error type in the table above is captured automatically. Tracelit monkey-patches `fetch`, `XMLHttpRequest`, `history.pushState`, `WebSocket`, and `console.error` (if enabled) to intercept failures at the source.
When you call `destroy()`, all patches are cleanly removed and the originals are restored.
***
## Use this AI prompt
```text theme={null}
Set up Tracelit error tracking in my project and make it production-safe.
Requirements:
1) Initialize Tracelit with my token: YOUR_TOKEN_HERE.
2) Enable monitorConsole only if needed and explain the tradeoff.
3) Make sure runtime errors, API errors, and unhandled promises are captured.
4) Add safe guidance so sensitive data is never logged to console.error.
5) Keep edits minimal.
6) Show changed files and explain how to test with one forced JS error and one failed API request.
```